# 开启轻量函数耗时统计
enable_profile(func_list=None)
get_profile_stats()
1
2
2
参数和返回:
| API | 说明 |
|---|---|
enable_profile() | 统计全部被 runner 调用的用户函数 |
enable_profile(["handle_bar", "trade"]) | 只统计指定函数名 |
get_profile_stats() | 返回当前进程内统计快照 |
示例1:开启用户函数轻量耗时统计
def init(context):
    context.stock = "000001.SZ"
    enable_profile()

def handle_bar(context, bar_dict):
    order_target_percent(context.stock, 1)

def after_trading(context):
    stats = get_profile_stats()
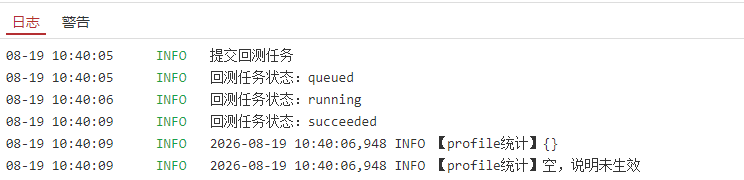
    # 验证方法:看日志里 stats 是否有内容(非空字典)
    log.info(f"【profile统计】{stats}")
    if stats:
        for func_name, info in stats.items():
            log.info(f"  {func_name}: 调用{info.get('count', '?')}次, 耗时{info.get('time', '?')}")
    else:
        log.info("【profile统计】空,说明未生效")
1
2
3
4
5
6
7
8
9
10
11
12
13
14
15
16
2
3
4
5
6
7
8
9
10
11
12
13
14
15
16
示例1说明
enable_profile()时获取到的结果情况

注释掉enable_profile()后